Activities in Jupyter
![]()
Jupyter is a programming environment that can be hosted remotely on a server. This environment has access to the database that stores the information collected by the schools' measurement stations. To learn a little more about JupyterLab click here (in English).
Upon entering the analysis environment, students have access to interactive analysis activities placed in "virtual exercise books" (notebooks). Notebooks are interesting because they integrate, on the same screen, instructions for carrying out activities and exercises.
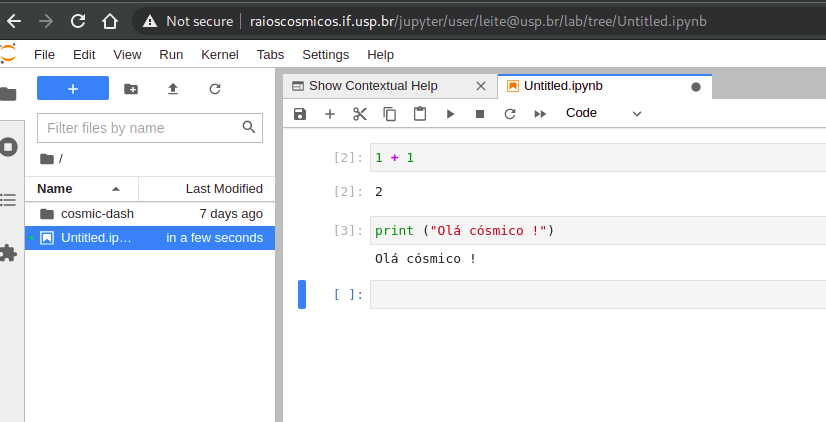
The Jupyter screen in your internet browser
To carry out notebook activities you don't need to know anything about programming!
However, that doesn't stop you from looking beyond 'notebooks' and building your analysis programs in the future.
As all processing is done on the server, any type of computer with internet access, whether "powerful" or not, can access the activities. Although it is not practical – due to the size of the screen and keyboard – even from a cellphone it is possible to access the analysis environment!
To access our server click here
To access the Jupyter programming environment, you must request access. Ask your teacher how to request access.
Your activities are always saved on the server. Each student has an exclusive area. Information saved in the database includes:
- Which sensors detected a signal in that event;
- Station position;
- Signal width;
- Number of events detected;
- Extra GPS information.
List (proposed) of activities (click to expand)
Section 1: Analysis of the detector’s obtained data
Activity 0: Exploring the JupyerLabnotebookActivity 1: HistogramsActivity 2: Understanding the operating conditions of the experimentActivity 3: Exploring the dataActivity 4: Determining cosmic ray flux from your station
Coming soon:
Activity 5: Integrating data from two stationsActivity 6: Influence of weather conditions on the flux of cosmic raysActivity 7: Angular distribution of the flux of cosmic raysActivity 8: Selecting cosmic ray events
Section 2: Analysis of Monte Carlo’s generated data
Activity 0: What is a simulation?Activity 1: What information can we obtain from the simulation?
Coming soon:
Activity 2: Visualization and analysis of events.
Section 3: Operating the detector (Coming Soon)
Activity 0: Understanding the detectorActivity 1: How do I know that what I am detecting are cosmic rays?Activity 2: Detector calibrationActivity 3: Operating a cosmic ray station
Section 4: Permanent activities (Coming Soon)
Activity 1: Monitoring the experiment
Now it’s up to you!
In the top bar 'Activities' you will find several proposals to explore the data, analyze it, and draw your conclusions about our Cosmic's detection of muons.
Have a good job!